We Went Looking for the State of AI in APAC Insurance. This Is Everything That Actually Exists
Executive Summary
On Tuesday we argued that almost every AI figure circulating in Asia-Pacific insurance was measured in another market, another industry or another decade, and we promised a benchmark of our own for Wednesday.

That benchmark is published today, and it is a different object from the one we announced. We said we would release a 22-page report built on original data across roughly 60 APAC insurers. We have not surveyed 60 APAC insurers, and implying a sample we do not have would have been the exact failure we had just described. So the unit of analysis changed: instead of surveying insurers, we audited the research.
State of AI in APAC Insurance 2026 - The Evidence Register assesses 35 studies, surveys and supervisory exercises published in 2025 and 2026 that are being cited to APAC insurance boards. Each is tested against a disclosure floor: five facts a study must publish before a board can responsibly act on it - the unit of analysis, the sample size, the market composition, the fieldwork window, and who paid for it.
The results:
- Two of the 35 clear all five. The European supervisor EIOPA, which surveyed 347 insurance undertakings across 25 EU and EEA member states, covering an estimated 80% of 2024 EU gross written premiums, with fieldwork dated 8 May to 22 July 2025 (EIOPA, 2026). And the Cambridge Centre for Alternative Finance, whose 628 respondents across 151 operational jurisdictions, fielded on Qualtrics in ten languages between October 2025 and January 2026, come with a published limitations section that concedes self-selection bias in writing (CCAF, 2026).
- Neither reports a single finding about Asia-Pacific insurers. EIOPA's remit stops at Europe. The CCAF report's insurance figure and its Asia-Pacific figure both come from multiple-choice questions and are never cross-tabulated - so any statistic circulating as "CCAF found X% of APAC insurers…" has been fabricated by the person quoting it.
- The number of studies that clear the disclosure floor and report a finding measured on Asia-Pacific insurers is zero.
- The only disclosed Asia-Pacific insurance sample size we located anywhere in the 35 is EY and the Institute of International Finance's chief risk officer survey - 9% of 106 organizations, roughly ten - and no AI finding in it is broken out regionally (EY/IIF, 2026).
- Australia's prudential regulator ran the closest thing to an APAC equivalent and published no numbers at all. APRA's letter to industry of 30 April 2026 states that it "conducted a targeted engagement on a group of selected large banks, insurers and superannuation trustees in late 2025". The entity count, the split between banks, insurers and trustees, and any quantitative finding are absent from both the letter and the media release (APRA, 2026).
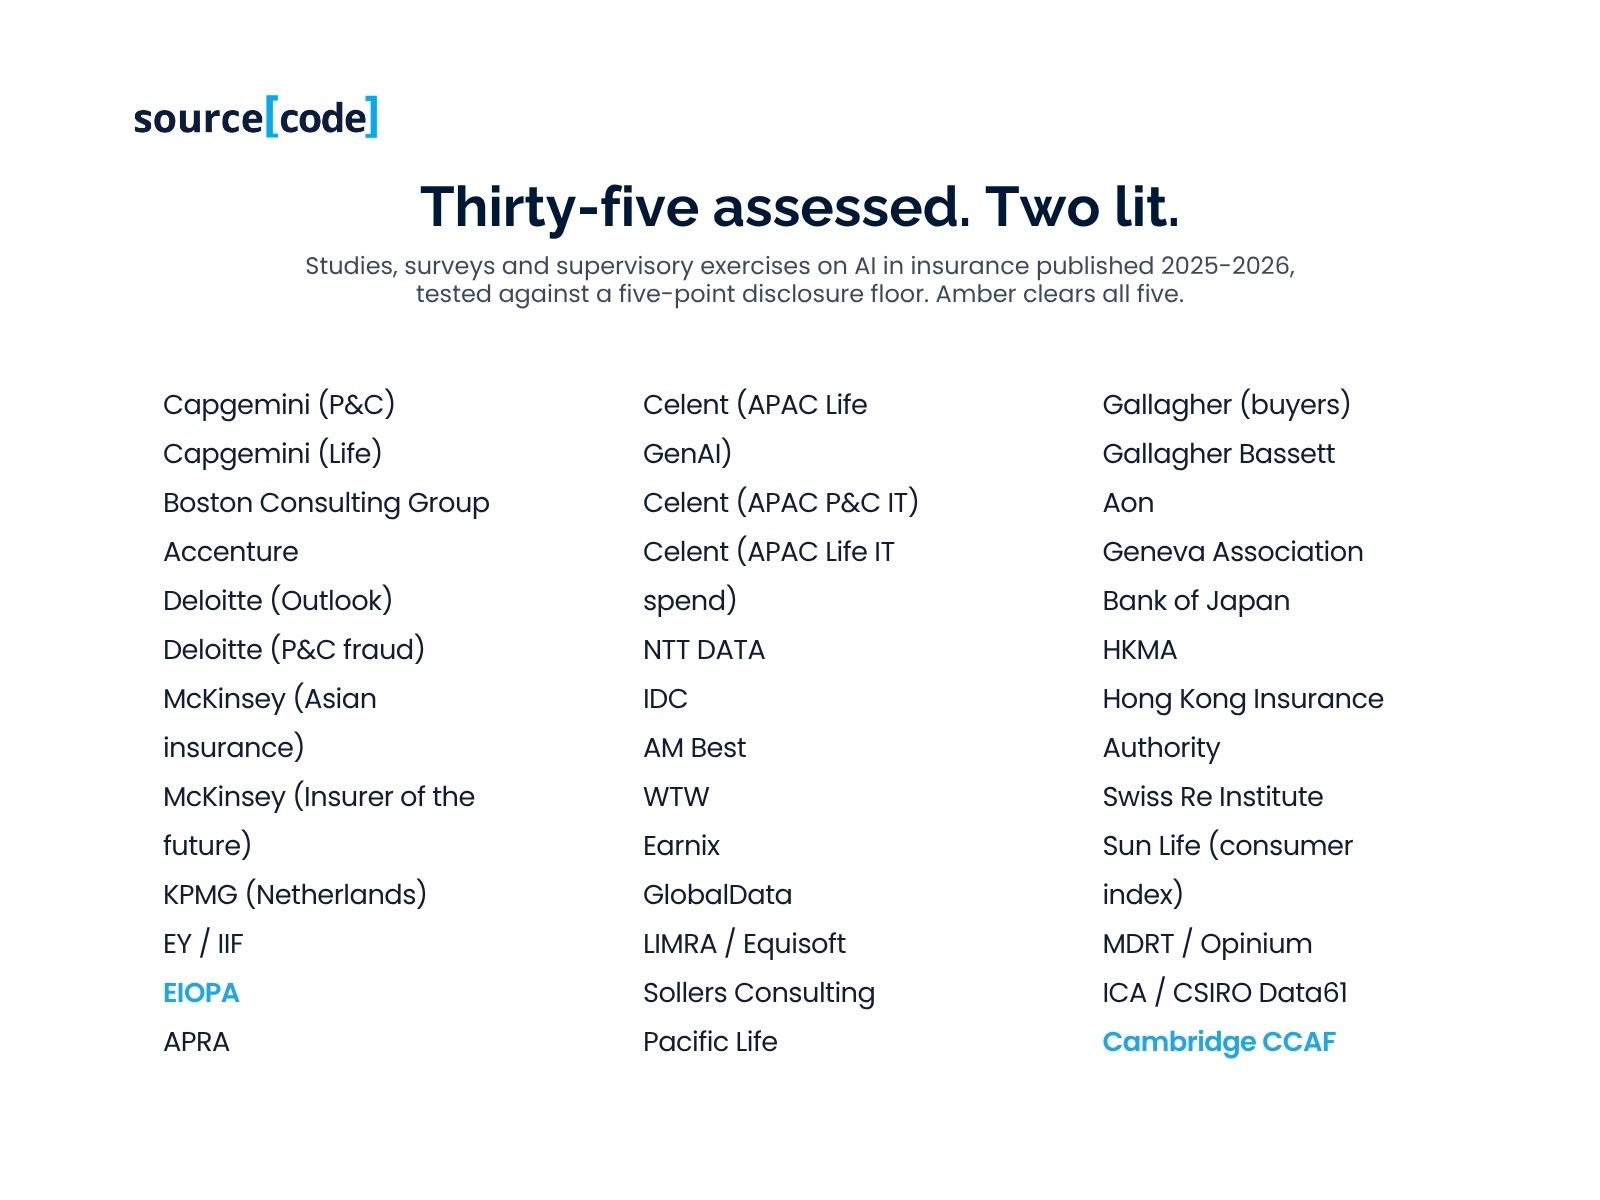
The register also carries the good news: numbers measured on Asia-Pacific insurers do exist - they are published by the insurers themselves, and nobody is aggregating them.
Introduction: What Changed Between Tuesday and Wednesday
Nothing changed. That is the point worth being honest about.
The plan to publish a 60-insurer benchmark was written in July. The research that killed it was done in August. Somewhere between those two dates it became clear that the report we had scheduled would have had to invent the thing it was criticizing others for inventing - and that the interesting finding was sitting in the gap where that survey should have been.
A market that has never been surveyed is not a data problem. It is a condition with consequences: every AI business case written in an APAC insurer this year was assembled from evidence about somebody else, and nobody can tell whether they are ahead of their peers or behind, because the peer set has never been measured.
The register maps that condition. It is deliberately unglamorous; its most useful pages list what failed.
Industry Context: Europe Has a Number. Asia-Pacific Has a Letter.
The cleanest way to see the asymmetry is to put two supervisory documents side by side.
EIOPA, February 2026. The European insurance supervisor surveyed solo insurance undertakings drawn from the Solvency II database, instructing national competent authorities to cover at least 60% of gross written premiums in each market. The result: 347 undertakings, 25 member states, coverage estimated at 80% of 2024 EU gross written premiums, fieldwork between 8 May and 22 July 2025. Headline findings: almost 65% of undertakings are already actively using generative AI, with a further 23% planning to within three years; 64% of reported use cases are internal back-office applications and 36% customer-facing; and 49% have developed a dedicated AI policy, twice the 25% recorded in 2023 (EIOPA, 2026).
Note what that paragraph contains: a population, a sampling frame, a coverage estimate, a date range, a prior-year comparison on the same instrument.
APRA, April 2026. Australia's prudential regulator conducted a targeted engagement on selected large banks, insurers and superannuation trustees in late 2025, and wrote to industry calling for a step change in AI risk management and governance. The letter is careful, well-argued and entirely qualitative. It contains no sample size, no industry split and no adoption statistic. The accompanying media release describes the same exercise more broadly, as a review "across all its regulated industries" - a discrepancy in scope language a reader is entitled to notice (APRA, 2026).
This is not a criticism of APRA's supervisory judgement, which is not the same job as publishing statistics. It is an observation about what an Australian insurance board consequently has: nothing quantitative from its own supervisor, and 347 European undertakings' worth of detail about somebody else's market.
Elsewhere the picture is the same shape. MAS's 2025-26 AI work is a consultation and a voluntary toolkit rather than a survey. The Hong Kong Insurance Authority runs a participation cohort - a collaboration vehicle, not a data source, and it should not be cited as one. Bank Negara Malaysia consulted. IRDAI convened a working group. No Asia-Pacific insurance supervisor has published a survey of regulated insurers on AI use.
Current Challenges: Why the Commercial Research Does Not Fill the Gap
The obvious response is that consultancies and analysts cover what supervisors do not. They partly do - and the register shows exactly where that coverage stops.
The largest studies have real Asia-Pacific insurers in them and publish no Asia-Pacific cut. Capgemini's World Property and Casualty Insurance Report 2026 surveyed 344 senior executives across 18 markets - Australia, Hong Kong, India, Japan and Singapore among them - with fieldwork from December 2025 to March 2026. Every finding is reported at global aggregate. The markets appear only in the methodology (Capgemini Research Institute, 2026). The same is true of its life-insurance counterpart, of BCG's P&C perspectives, and of Accenture's insurance cut.
The dedicated Asia-Pacific insurer research exists and does not publish its sample. Celent runs what appears to be the only recurring, dedicated APAC insurer technology survey programme, including a third annual generative-AI study of APAC life insurers published in August 2025 and an Asia-Pacific P&C technology survey with fieldwork dated November 2024 to January 2025. Neither public page discloses how many insurers responded (Celent, 2025a; 2025b). The reports are paywalled; the sample sizes may well be inside them. From the outside, they are unusable as citations.
The widely-quoted figures are frequently not survey findings at all. The register names these individually, because they are the ones most likely to reach a board pack. NTT DATA's often-repeated claims that 22% of insurers have scaled AI to production and that 66% of the insurance workforce has adopted AI tools come from a publication that describes its own method as an analysis of industry data, insurer disclosures and third-party research - there is no survey and no sample (NTT DATA, 2026). A widely circulated 113-respondent industry poll discloses no geographic scope and no sampling frame. An analyst house's Asia-Pacific insurance predictions are written in the grammar of findings and carry no methodology.
And several well-known studies are simply about somebody else. A 400-executive insurance survey much-cited in this region covers "Australasia, Europe, the UK, the United States and Canada" - Australasia, not Asia-Pacific. A 152-carrier AI survey is effectively United States; a 59-insurer analytics survey is United States and Canada; a 103-executive underwriting survey was fielded in person at a single symposium in California. A candid seven-insurer study, which explicitly declines to draw quantitative conclusions from qualitative research and deserves credit for saying so, is Netherlands only (KPMG, 2026).
None of this is fraud. Every one of these publishers is honest inside its own document. The failure is in transmission: an executive summary crosses a regional boundary the methodology page never claimed to cross.
Key Trends: The Multi-Select Trap
One finding in the register is worth isolating, because it is the most common way a defensible study becomes an indefensible statistic.
The CCAF report is the best-documented instrument in the whole set. It publishes its platform, its ten languages, its fieldwork window, its 628 respondents split across fintechs, traditional financial institutions, AI vendors and regulators, and a limitations section stating plainly that responses "reflected the perceptions and self-assessments of respondents rather than independently verified metrics" (CCAF, 2026).
It also reports that insurance and Insurtech account for 16%, or 58, of its 352 industry respondents, and that Asia-Pacific accounts for 36%, or 125.
Both of those are multiple-choice questions. Respondents selected every sector they operate in and every region they operate in. The industry sector column sums to 228%; the region column to 144%. A diversified bank with a bancassurance arm ticks "insurance". A group operating in five regions is counted five times. Neither number is a count of companies, and the two are never crossed - the report contains no table pairing industry vertical with geography, and its own limitations section concedes that uneven distribution "limits the granularity of country, regional or sectoral-level analysis".
The report's primary analytical lens is not region at all. It is World Bank income group - advanced economies against emerging markets - a division running straight through Asia-Pacific, placing Japan, Australia, Singapore, Hong Kong, New Zealand and South Korea on one side and China, India, Indonesia, Vietnam, the Philippines and Thailand on the other. Its headline contrast, that advanced economies are far likelier to reach transformative adoption, therefore cuts through the region rather than describing it.
So when a slide says "Cambridge found that X% of APAC insurers…", the number did not come from Cambridge. It came from someone multiplying two multi-select percentages together.
Strategic Analysis: The Disclosure Floor
The disclosure floor is the minimum set of facts a study must publish before a board can responsibly act on it. There are five, and it is a pass-fail test rather than a sliding scale:
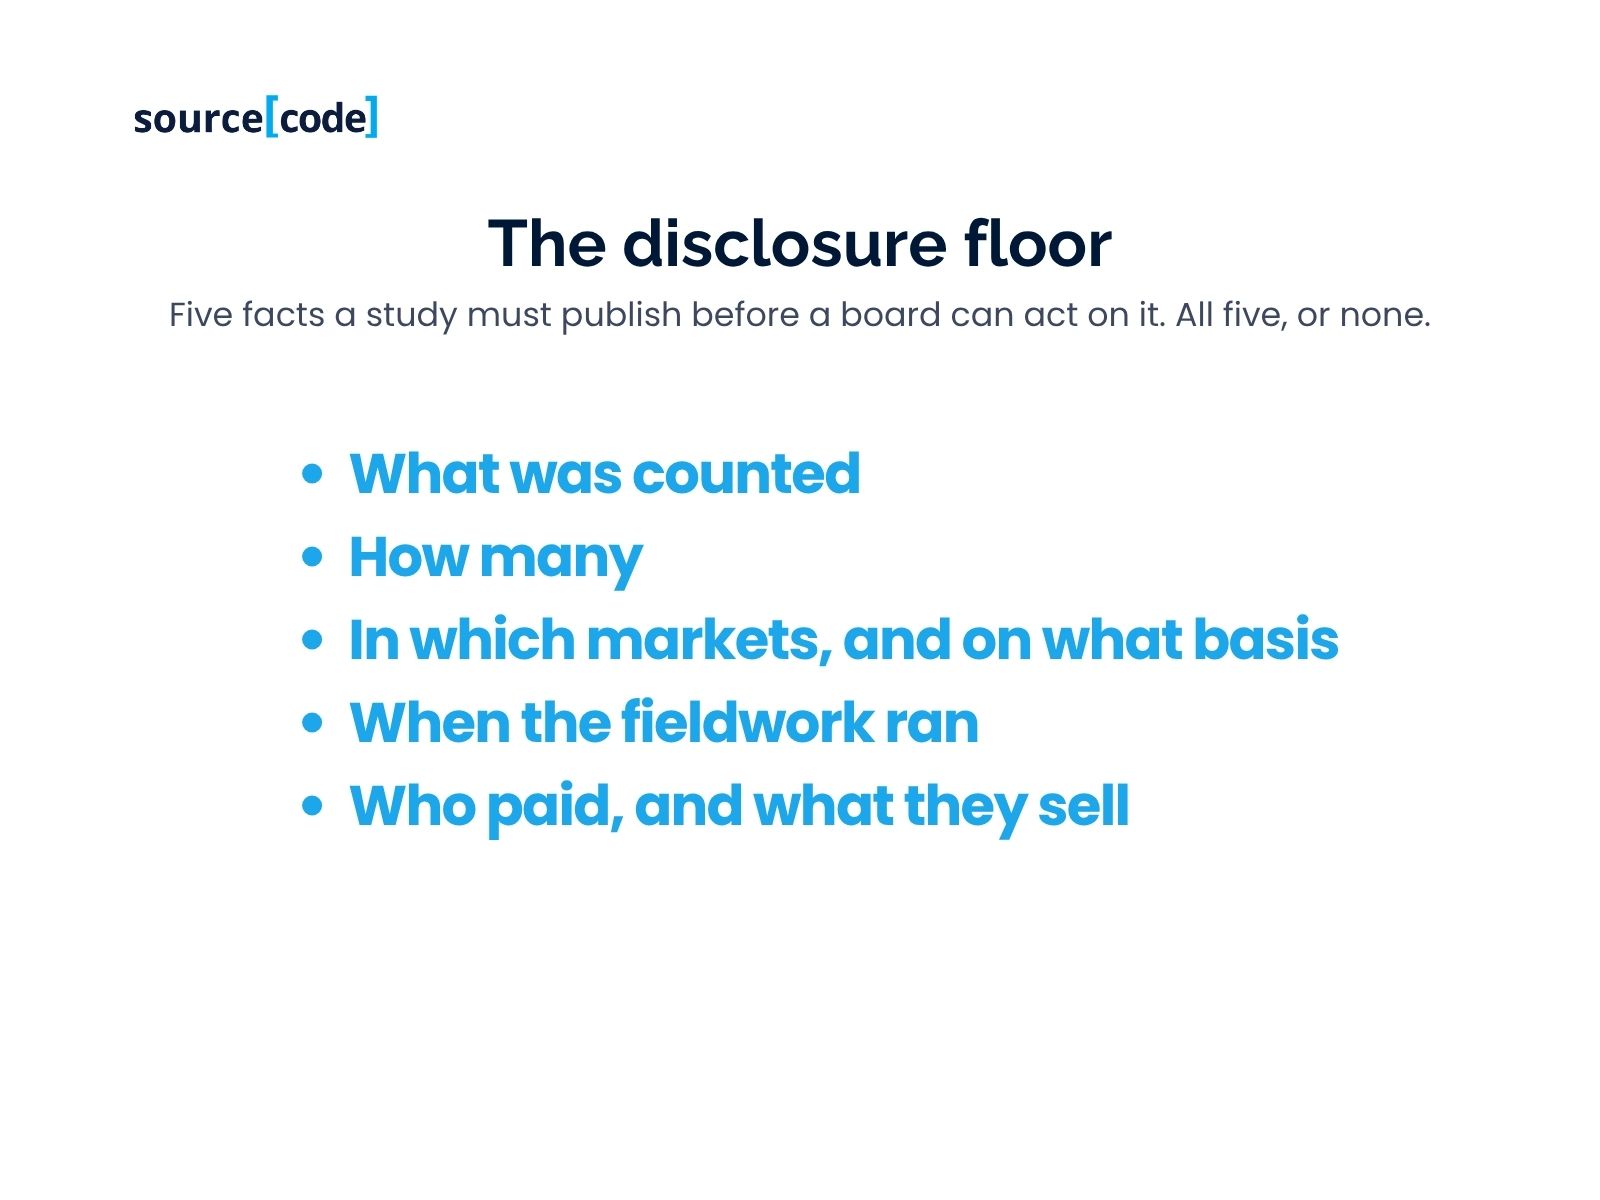
- Unit of analysis - what was counted. Insurers? Executives? Use cases? Consumers? Employees of insurance buyers?
- Sample size - an integer, for the population the headline figure describes.
- Market composition - which markets are in the sample, and on what basis the sample represents them.
- Fieldwork window - dated, not implied by the publication date.
- Sponsor and commercial interest - who paid, and what they sell to the people being described.
Tuesday's article introduced evidentiary distance: how far a figure sits from a measurement of your own business. The disclosure floor answers a prior question - whether a figure is admissible at all. A study can be close to you and still fail the floor, and a study can pass the floor and still be about a market on the other side of the world. Boards need both tests, in that order.
Applied across the 35, the distribution is stark. Two clear all five. Most fail on market composition - the sample exists and the markets are listed, but no regional basis is published. A significant group fails on unit of analysis, because the headline figure describes insurance buyers, consumers or cross-industry executives rather than insurers. Several fail on sample size entirely. And the intersection of "clears the floor" with "reports something measured on an Asia-Pacific insurer" is empty.
The honest counter-argument is that this standard would have stopped most useful research from ever being quoted, and that executives who waited for perfect disclosure were beaten by those who did not. True - and the floor is not a ban. It is a routing rule: figures that clear it can carry a target; figures that fail it can carry a direction; nothing that fails it belongs in the justification section of a capital request. The cost of ignoring that is not embarrassment. It is a programme measured against a number that was never about you.
Real-World Examples: The Numbers That Do Exist
The register's second half is more encouraging, and it is where the practical value sits. Asia-Pacific insurers do publish quantified AI results - in their own reports, about themselves, at a disclosure quality that mostly exceeds the commercial research.
The strongest example we found is FWD Group's 2025 annual results presentation, which reports 40% of medical underwriting time saved in Japan through an agentic AI underwriting tool. What makes it the best-documented AI figure in Asia-Pacific insurance is the footnote: September 2025 average underwriting time using the tool, against December 2024 average without it. Same process, two dated windows, stated basis. The same slide carries a 20% claims unit-cost reduction in Japan and a 10% annualized premium equivalent improvement in the Philippines, each footnoted to its own comparison (FWD Group, 2026).
Ping An reports that AI service representatives handled about 1,702 million interactions in 2025, 80% of the group's total customer service volume - a large number attached to an explicitly defined denominator, which is rarer than it sounds (Ping An, 2026).
Australia's disclosures are more mixed. Medibank reports 52 machine learning and AI models embedded in the business and a 60% reduction in complaint resolution time - the first a clean count, the second with no stated baseline period or complaint volume (Medibank, 2025). IAG reports 92 generative AI deployments and AI tools available to 60% of its workforce - investor-day figures with no headcount base, presented alongside 2030 targets a careless reader could mistake for achievements (IAG, 2026). Great Eastern announced a platform that "aims to reduce" adviser preparation time by around 75% - an intention, not a measurement (Great Eastern, 2026).
And then the absences, which are the finding. QBE's 2025 annual report discusses AI four times and attaches no metric to any of it. Tokio Marine's integrated report contains no internal AI deployment figure at all. Income Insurance's 2025 annual report states that greater automation "improved turnaround times, raised straight-through processing rates" - an insurer telling its stakeholders that a rate went up, and declining to say what the rate is.
That single sentence is the state of the Asia-Pacific insurance evidence base, written by an insurer, about itself.
Actionable Recommendations
Run the five-question floor on your next AI board pack. Ask of each external figure what was counted, how many, in which markets, when, and who paid. Anything that fails moves from the justification section to the context section. It takes under an hour and is the only recommendation here that produces a result this week.
Treat first-party disclosure as competitive intelligence, not marketing. Your competitors' annual reports contain better-specified AI figures than the research you are buying, and they are free. The register's first-party table is the starting set.
Publish one number about yourself, with its denominator. No one can benchmark this market because almost no one discloses. An insurer that publishes one well-specified figure - a rate, its population, its comparison window - becomes the reference point in everyone else's board pack, which is cheaper authority than most marketing budgets buy.
Make your internal measurement match the floor. If you cannot state the unit, the population, the window and the comparison basis for your own AI metrics, you will not be able to answer a supervisor's inventory and materiality questions either. They are the same exercise.
Stop quoting the figures named in the register's exclusions list. They are circulating in this region now, they have no sampling basis, and at least one is very likely the true origin of the "22% of APAC insurers" line that has been repeated back to us in three separate client conversations this year.
The sourceCode Perspective
We build and run engineering teams for insurers, banks and fintechs across Australia and Southeast Asia, so the bias is declared: we benefit when the answer is "instrument it properly", and that is again this article's recommendation.
With that stated, here is what changing this report cost. A 60-insurer survey would have been a better lead magnet; original data attracts press pickup and backlinks in a way a methodology audit does not, and we knew it, because that was the plan. What we could not do was publish a piece on Tuesday demanding that everyone state their sample, and follow it on Wednesday with a sample we had not collected.
The register is what we could stand behind, and it turned out to be the more useful object. It is also a commitment: the 2027 edition opens as a fielded survey with its methodology published before fieldwork begins - unit of analysis, target population, market quotas, window and sponsor stated up front, so it can be judged against the same floor we applied to everyone else. If you run AI in an Asia-Pacific insurer, the register's last page is where you put your hand up.
Conclusion
The state of AI in Asia-Pacific insurance is that nobody has measured it, and that the region has been making capital decisions on European supervisory data, American fraud economics and global aggregates that never published an Asian cut.
That is a market condition, not a scandal, and it is fixable in one direction only: from the inside. The numbers that survive scrutiny in this region today are the ones insurers published about themselves. There are not many. There should be more.
Until then, the most valuable page in any research report is the methodology, and the most valuable question at any board table is the one nobody enjoys asking: who exactly was counted, and when?
Thirty-five studies assessed against a five-point disclosure floor. Every pass and every failure listed by name. A first-party disclosure table of Asia-Pacific insurers who have published quantified AI results about themselves. A gap map of what no one has measured. Four fields, no gate on the methodology section - that part is open to everyone.
Today's poll: Which AI use case is delivering the most ROI in your business today? Claims triage · Customer service · Underwriting · Fraud detection. Vote and we will send the register directly.
If you would rather start with your own position than with the market's, leave us a message here →
Frequently Asked Questions
What is a disclosure floor? A disclosure floor is the minimum set of facts a research study must publish before a decision-maker can responsibly act on its findings. In the State of AI in APAC Insurance 2026 register it consists of five items: the unit of analysis, the sample size, the market composition and the basis on which the sample represents those markets, the fieldwork window, and the sponsor together with any commercial interest in the subject. It is a pass-fail test applied before any assessment of how relevant a finding is.
What is a unit of analysis? The unit of analysis is what a study actually counted. In AI-in-insurance research it is most often one of: insurance undertakings, individual executives, individual employees, use cases, or consumers. Two studies reporting the same headline percentage about "insurance and AI" can be measuring entirely different populations, which is why the unit of analysis is the first item on the disclosure floor.
Has any Asia-Pacific insurance supervisor surveyed insurers about AI use? None that has published results, on the evidence available at the time of writing in August 2026. The European supervisor EIOPA published a generative AI survey of 347 insurance undertakings across 25 EU and EEA member states on 2 February 2026. In Asia-Pacific, APRA conducted a targeted engagement with selected large banks, insurers and superannuation trustees in late 2025 and published qualitative findings with no sample size and no statistics. MAS has consulted on guidelines and published a voluntary toolkit. The Hong Kong Insurance Authority runs a participation cohort rather than a survey.
How many studies clear the disclosure floor? Two of the 35 assessed for the 2026 register: EIOPA's generative AI market survey of European insurers, and the Cambridge Centre for Alternative Finance's 2026 Global AI in Financial Services Report. Neither reports a finding measured specifically on Asia-Pacific insurers. The number of studies that clear the disclosure floor and report an Asia-Pacific insurance finding is zero.
Why can't the Cambridge CCAF report be used for an APAC insurance statistic? Because both relevant figures come from multiple-choice questions and are never cross-tabulated. Insurance and insurtech represent 16% (n=58) of 352 industry respondents, and Asia-Pacific represents 36% (n=125) - but respondents selected every sector and every region they operate in, so the columns sum to 228% and 144% respectively, neither figure is a count of companies, and the report publishes no table pairing sector with region. Any "X% of APAC insurers" figure attributed to that report has been derived by the person quoting it, not published by its authors.
What is a first-party AI disclosure? A first-party AI disclosure is a quantified statement an insurer publishes about its own use of AI, in its own annual report, results presentation or official release. It carries no substitution of geography, industry or entity, which makes it the most directly usable evidence available to a comparable insurer - provided it also states the population the figure is measured over and the comparison basis.
Which Asia-Pacific insurers publish usable first-party AI figures? On the evidence assessed for the 2026 register, the best-specified examples are FWD Group, which footnotes its Japanese medical underwriting improvement to two dated comparison windows, and Ping An, which attaches its AI service volume to total customer service volume as an explicit denominator. Medibank, IAG and Bajaj Allianz publish quantified figures with weaker denominators. QBE, Tokio Marine, Income Insurance, China Pacific Insurance, nib and Allianz Malaysia publish no quantified AI metrics in the documents assessed.
Why did sourceCode change the format of this benchmark? Because the originally scheduled format - a survey of approximately 60 Asia-Pacific insurers - was not backed by fieldwork we had conducted, and the article published on 18 August 2026 argued that studies must state their samples. Publishing an implied sample the day after making that argument would have failed our own standard. The unit of analysis was changed from insurers to published studies, and the change is stated on the register's first page.
Is the register free? The register requires a four-field form. The methodology section, including the disclosure floor definition and the full list of assessed studies with their pass-fail results, is published without a gate so that the method can be checked by anyone, including the publishers whose studies it assesses.
References
Australian Prudential Regulation Authority, 2026. Letter to industry: Artificial intelligence (AI), 30 April, and accompanying media release APRA calls for a step change in AI-related risk management and governance (scope stated as "a targeted engagement on a group of selected large banks, insurers and superannuation trustees in late 2025"; no sample size, industry split or quantitative finding disclosed in either document). Available at: https://www.apra.gov.au/apra-letter-to-industry-on-artificial-intelligence-ai [Accessed 9 August 2026].
Cambridge Centre for Alternative Finance, 2026. The 2026 Global AI in Financial Services Report: Adoption, Impact and Risks, Cambridge Judge Business School, 28 April (628 respondents - 203 fintechs, 149 traditional financial institutions, 146 AI vendors, 130 regulators; 151 operational jurisdictions, 124 headquarter countries; Qualtrics, ten languages, fieldwork October 2025-January 2026; sector and region questions are multiple-choice and are not cross-tabulated; primary analytical cut is World Bank income group). Available at: https://www.jbs.cam.ac.uk/wp-content/uploads/2026/05/ccaf-2026-04-28-global-ai-in-financial-services-report-2.pdf [Accessed 9 August 2026].
Capgemini Research Institute, 2026. World Property and Casualty Insurance Report 2026, 5 May (344 senior insurance executives across 18 markets including Australia, Hong Kong, India, Japan and Singapore; executive fieldwork December 2025-March 2026; no regional or Asia-Pacific breakdown of findings published - methodology page of the report PDF, not the press release). Available at: https://www.capgemini.com/insights/research-library/world-property-and-casualty-insurance-report/ [Accessed 9 August 2026].
Celent, 2025a. GenAI-oneers in APAC Life Insurance: 2025 Edition, 29 August (third annual generative AI in insurance survey; respondents described as insurance executives in technology, data and innovation roles; no sample size, country list or fieldwork window disclosed on the public page). Available at: https://www.celent.com/en/insights/gen-ai-oneers-in-apac-life-insurance-2025-edition [Accessed 9 August 2026].
Celent, 2025b. Dimensions: Asia-Pacific P&C Insurance IT Pressures and Priorities, 25 February (online survey of Asia-Pacific P&C insurance technology executives, fieldwork November 2024-January 2025; no sample size disclosed on the public page). Available at: https://www.celent.com/en/insights/640462625 [Accessed 9 August 2026].
European Insurance and Occupational Pensions Authority, 2026. Generative AI Market Survey: Outlook, Use Cases and Risk Management, EIOPA-BoS-25-679, published 2 February (347 insurance undertakings across 25 EU and EEA member states; national competent authorities instructed to cover at least 60% of gross written premiums per market; estimated coverage 80% of 2024 EU gross written premiums; fieldwork 8 May-22 July 2025). Available at: https://www.eiopa.europa.eu/eiopa-survey-generative-ai-shows-swift-cautious-adoption-among-europes-insurers-2026-02-02_en [Accessed 9 August 2026].
EY and Institute of International Finance, 2026. Insurance Chief Risk Officer Survey, 27 April (106 organisations; regional composition Americas 49%, EMEIA 42%, Asia-Pacific 9%; fieldwork November 2025-January 2026; no AI finding disaggregated by region). Available at: https://www.ey.com/en_nl/newsroom/2026/04/insurance-cros-are-faced-with-an-evolving-risk-landscape-defined-by-speed-volatility-and-interconnection-ey-iif-survey [Accessed 9 August 2026].
FWD Group Holdings, 2026. 2025 Annual Results Presentation, 16 March, p.18 (40% medical underwriting time saved in Japan, footnoted as September 2025 average using an agentic AI underwriting tool against December 2024 average without it; 20% unit cost reduction in Japanese claims assessment; 10% annualised premium equivalent improvement in the Philippines). Available at: https://www.fwd.com/ [Accessed 9 August 2026].
Great Eastern Holdings, 2026. FY2025 results media release, 24 February (AI-enabled advisory platform stated to aim at an approximately 75% reduction in adviser preparation time - a stated objective, not a measured outcome). Available at: https://www.greateasternlife.com/sg/en/about-us/media-centre/media-releases/fy-25-financial-results.html [Accessed 9 August 2026].
Insurance Australia Group, 2026. Ambition 2030 investor day presentation, 12 May (92 generative AI deployments; AI tools available to 60% of workforce, no headcount base stated; note that 100% straight-through processing and 90%+ automated controls appear in the same deck as 2030 targets, not achievements). Available at: https://announcements.asx.com.au/asxpdf/20260512/pdf/06zhb3wmkj2bxy.pdf [Accessed 9 August 2026].
Income Insurance, 2026. Annual Report 2025 (states that greater automation "improved turnaround times, raised straight-through processing rates"; no rate published). Available at: https://www.income.com.sg/ [Accessed 9 August 2026].
KPMG, 2026. State of AI in Insurance 2026, February (seven insurers, Netherlands only, structured interviews March-December 2025; the report states that given the qualitative nature of the research it refrains from drawing quantitative conclusions). Available at: https://assets.kpmg.com/content/dam/kpmg/nl/pdf/2026/state-of-ai-in-insurance-2026.pdf [Accessed 9 August 2026].
Medibank Private, 2025. Annual Report 2025, p.22 (52 machine learning and AI models embedded in the business; 60% reduction in complaint resolution time through an AI-assisted process; no baseline period or complaint volume stated). Available at: https://www.medibank.com.au/content/dam/retail/about-assets/pdfs/investor-centre/annual-reports/Medibank_AnnualReport2025.pdf [Accessed 9 August 2026].
NTT DATA, 2026. Insurtech Global Outlook 2026, June (self-described method: analysis of industry data, market trends and risk indicators drawing on insurer disclosures, third-party research and internal insight; no primary survey and no sample size; publisher sells AI services to insurers). Available at: https://www.nttdata.com/global/en/news/press-release/2026/june/061000 [Accessed 9 August 2026].
Ping An Insurance (Group) Company of China, 2026. 2025 Annual Results, 26 March (AI service representatives handled approximately 1,702 million interactions, 80% of total customer service volume in 2025; over 230,000 employees used the internal AI agent platform). Available at: https://group.pingan.com/ [Accessed 9 August 2026].
QBE Insurance Group, 2026. Annual Report 2025, 19 February (artificial intelligence discussed in the chief executive's review and treated as a risk category; no quantified AI or automation metric disclosed). Available at: https://www.qbe.com/ [Accessed 9 August 2026].
Tokio Marine Holdings, 2025. Integrated Annual Report 2025 (artificial intelligence discussed as an external environment factor; no internal AI deployment metric disclosed). Available at: https://www.tokiomarinehd.com/en/ir/ [Accessed 9 August 2026].