source[code] | _BFSI Technology Insight _
Key Takeaways
- The problem is rarely that claims AI has no ROI - it is that most business cases are built on activity metrics (claims touched, tickets auto-closed) rather than the financial outcomes a CFO can defend: cycle time, leakage, and cost-to-serve (Gartner, 2026).
- Only around a quarter of executives across industries report their organisations have created significant value from AI initiatives, and most companies still do not track financial KPIs for those initiatives at all (BCG, 2025).
- Leakage - the gap between what a claim should have cost and what it actually cost - typically runs 7-14% of total claims payouts against insured losses that regularly exceed US$100 billion a year, making it the largest single number on the table and the hardest to isolate (Ballot and Brassard, 2026).
- Claims account for roughly 70% of premium dollars collected, so cost-to-serve is where AI's P&L impact should be most visible - yet insurer operating expense as a share of revenue has risen 17% globally and 60% in North America since 2005, despite two decades of technology investment (Kamalapurkar and Cline, 2021; McKinsey & Company, 2026).
- A credible ROI case has to be designed into the initiative's data model and baseline before go-live - which of the three metrics (cycle time, leakage, cost-to-serve) can actually be isolated depends on what was instrumented before the AI arrived, not on what the AI achieved after.
The Business Case Was Approved. The Dashboard Still Can't Prove It
Most claims AI initiatives at Australian and Gulf insurers clear the investment committee on a business case promising a defensible number: a percentage reduction in cycle time, a basis-point improvement in loss ratio, a lower cost per claim. Eighteen months later, adoption is high and the CFO is being asked to sign off on a benefits report leaning heavily on volume metrics - claims auto-triaged, FNOL calls deflected, adjuster hours "saved." None of those, on their own, tell the CFO whether the P&L moved.
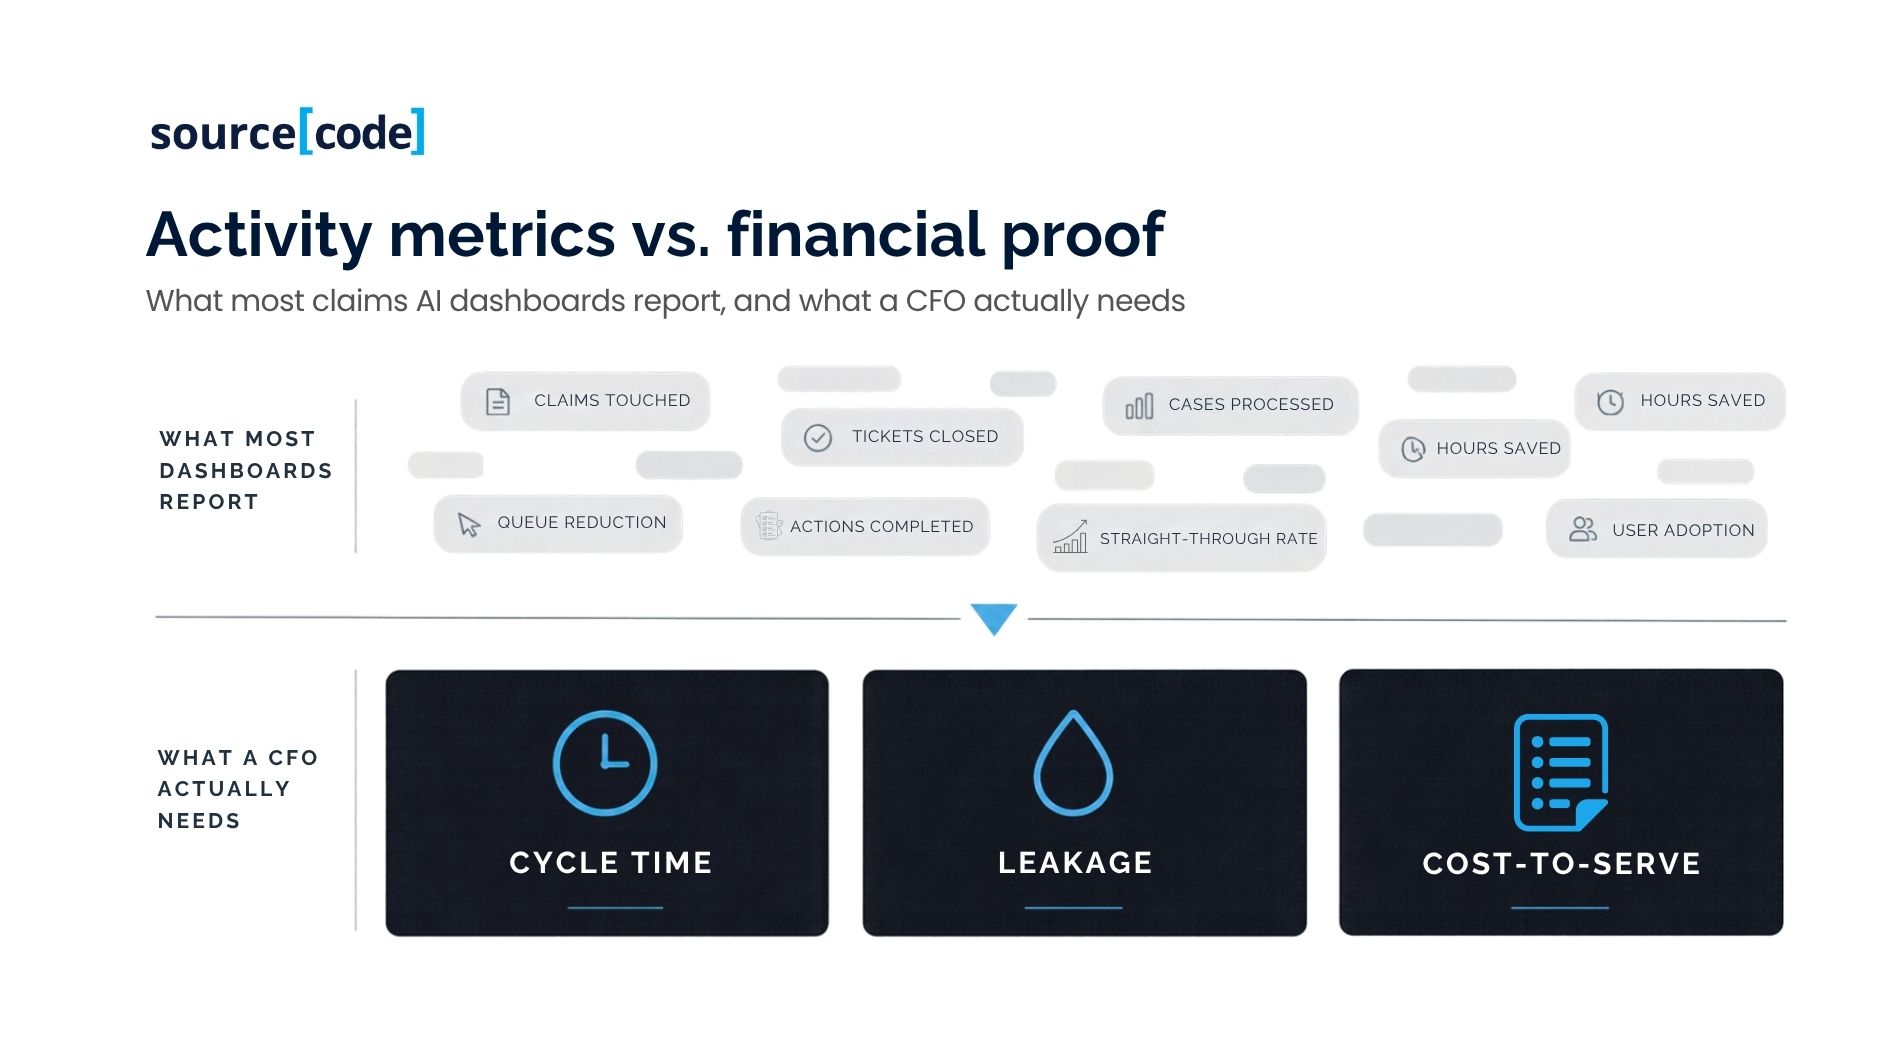
This is not a new failure mode. Gartner's 2026 analysis of enterprise AI value measurement makes the point bluntly: "activity-based metrics like 'productivity gains' or 'time saved' don't translate to boardroom language" (Gartner, 2026). The recommendation is to anchor measurement in metrics with a direct line to cost, revenue, or retention - for a claims book, that means cycle time, leakage, and cost-to-serve, not tickets processed. Retention illustrates the trap: Deloitte's 2025 analysis of claims transformation cites a J.D. Power study finding only around 4% of customers who rated their digital claims experience "excellent" or "perfect" were at risk of attrition (Kamalapurkar, 2025). A genuinely strong signal - but a customer-experience metric, not a cost or loss-ratio one, and a CFO's ROI case needs the latter even when the former is moving well.
The gap is not unique to insurance, and it is not small. BCG's research on enterprise AI value realisation found that only around a quarter of executives report their companies have created significant value from AI initiatives, and - more tellingly - "most companies do not track financial KPIs of their AI initiatives" at all (BCG, 2025). The same research found that companies concentrating investment in fewer, deeper use cases report roughly double the ROI of those spreading thinly across many - a focus problem, but also a measurement discipline problem, since depth without financial tracking still can't prove itself (BCG, 2025).
Insurance-specific evidence points the same direction. McKinsey's 2026 analysis of AI's economics in insurance notes that insurer operating expenses as a share of revenue have risen 17% globally and 60% in North America since 2005 - a two-decade run in which the industry has not lacked for technology investment, only for investment that shows up as a lower cost base (McKinsey & Company, 2026). The same analysis observes that productivity gains from digital tools have been "consistently offset by rising IT costs, compliance overhead, and the complexity introduced by layering new digital tools onto legacy operating models" (McKinsey & Company, 2026). A claims AI programme can be technically successful - faster triage, higher first-contact resolution - and still invisible in cost-to-serve, because the savings are absorbed elsewhere before reaching the P&L.
Why the Three Numbers That Matter Are the Three Hardest to Isolate
Cycle time, leakage, and cost-to-serve are the right metrics precisely because they are the ones a CFO can take to a board and a regulator. They are also the three that are structurally difficult to attribute to a single initiative, because claims operations rarely sit still long enough to give AI a clean before/after.
Cycle time looks like the easiest of the three to measure - FNOL to settlement is a timestamp problem, not a modelling problem. Deloitte's analysis of digital claims transformation found that digital processing reduced homeowners claim payment time by up to 5.5 days compared to traditional handling, a genuine and measurable effect (Kamalapurkar and Cline, 2021). But cycle time is also the easiest to move for the wrong reasons. If AI triage routes straightforward claims to a fast automated path and complex claims into a now-more-crowded manual queue, the average cycle time improves while the total cost of handling complexity does not - and a CFO reading only the average will overstate the win. Segmentation by claim complexity, not a single blended number, is what makes cycle time defensible.
Leakage is the largest number and the hardest to pin down, because "what a claim should have cost" is a counterfactual, not an observation. Insurance Thought Leadership's 2026 analysis puts total leakage at 7-14% of claims payouts against losses that regularly exceed US$100 billion annually - industry-wide exposure large enough that a one- or two-point improvement is material to any insurer's loss ratio (Ballot and Brassard, 2026). But that benchmark is built from audit sampling and settlement-variance methodology that most carriers were not running consistently before their AI initiative existed. Without a pre-existing, methodologically stable measure of "should-cost," a post-go-live leakage number has no baseline to be compared against - it is a new measurement, not a tracked improvement.
Cost-to-serve is where the CFO's interest is most direct, and where attribution is most contaminated by everything else happening in the business. Claims represent roughly 70% of premium dollars collected, so even a modest percentage improvement is a large absolute number (Kamalapurkar and Cline, 2021). But cost-to-serve moves with headcount changes, panel repricing, catastrophe volume, reinsurance treaty adjustments, and office consolidation - all frequently running in parallel with a claims AI rollout, and none of which the AI caused. McKinsey's broader analysis found domain-level transformations elsewhere in the insurance operating model - onboarding, agent productivity - produced double-digit gains when pursued as full end-to-end redesigns rather than isolated point solutions (McKinsey & Company, 2026). The lesson for claims is the same: a cost-to-serve number not segmented from concurrent change will always be ambiguous about what caused it.
The Isolation Ledger: Designing the ROI Case Before Go-Live
The fix is not a better dashboard. It is a measurement design decision made at the same time as the technology decision - before the first claim touches the new system. We call this discipline the Isolation Ledger, and it has four components.
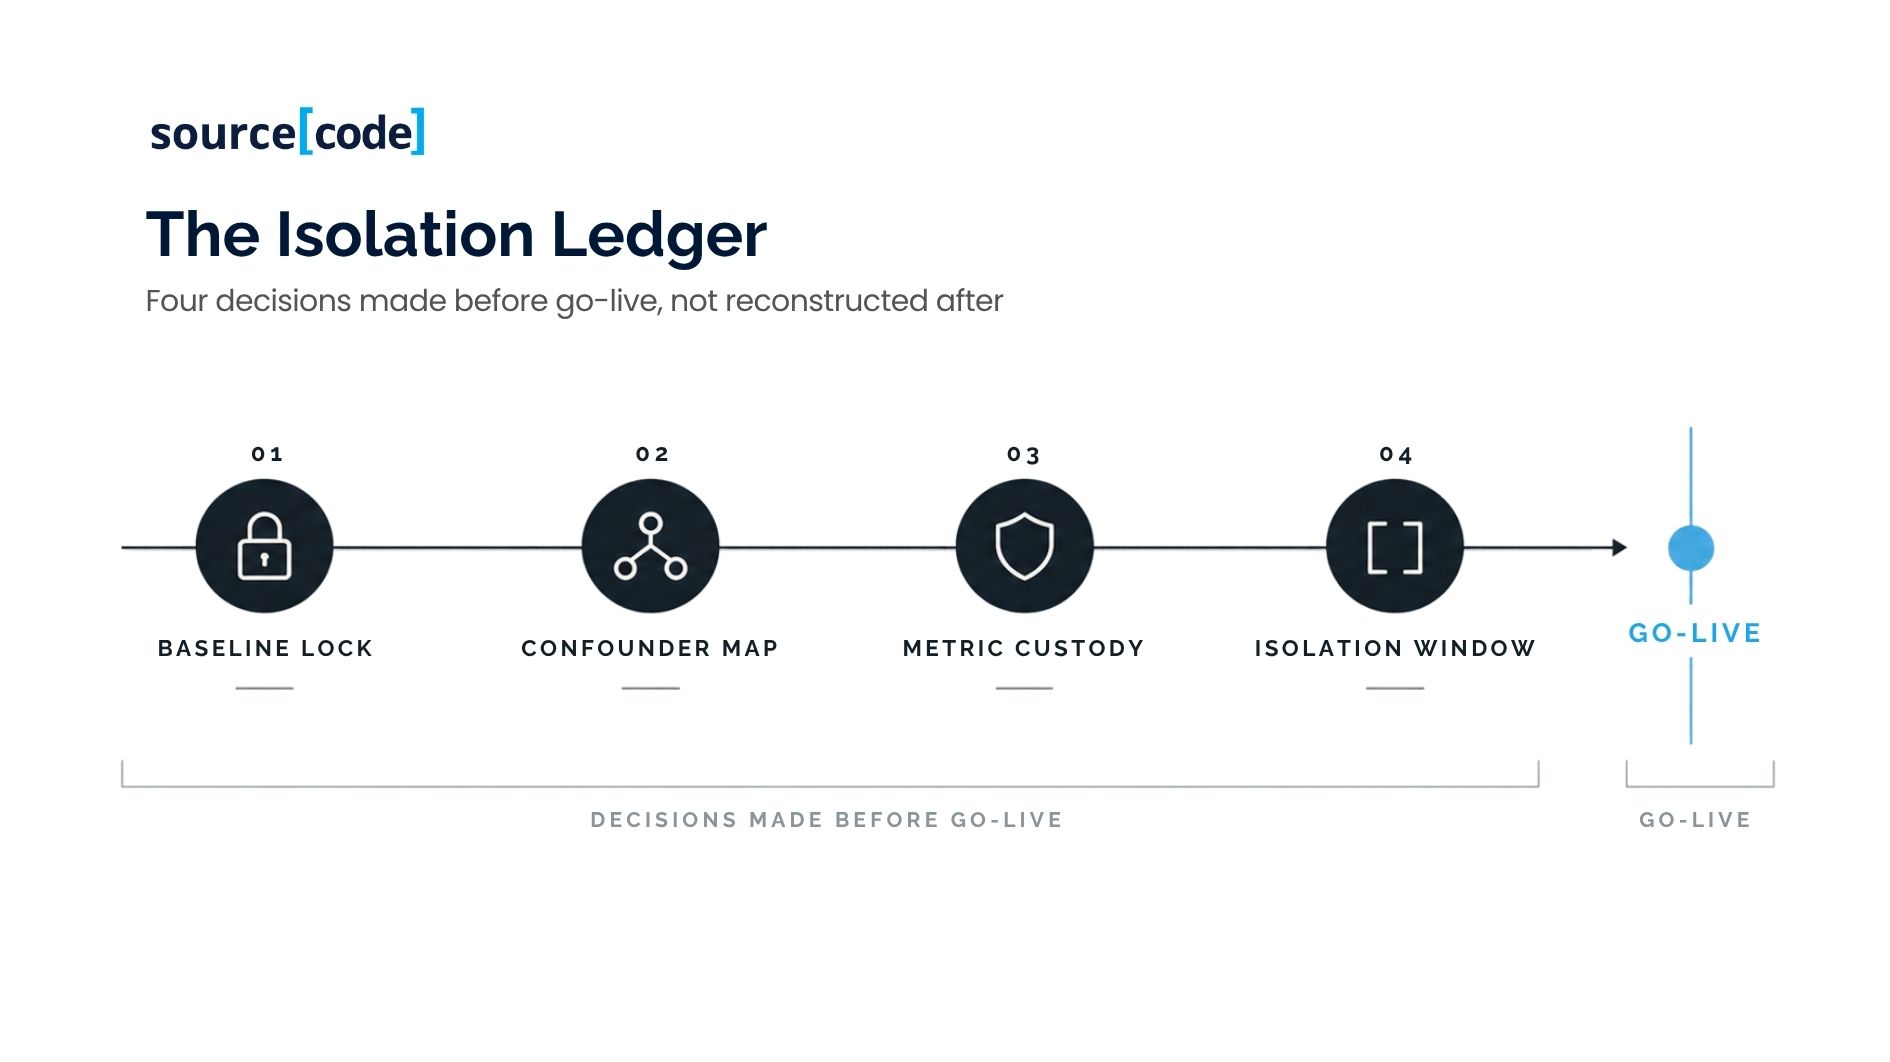
1. Baseline Lock. Before go-live, freeze the pre-AI values for cycle time, leakage, and cost-to-serve at the same segmentation the AI will operate on - by peril, claim complexity tier, channel, state or jurisdiction. A single blended baseline cannot support a segmented post-go-live comparison. If the organisation cannot produce this baseline at the right granularity today, that is itself the finding: the metric isn't yet measurable, and the business case should say so rather than promise a number it can't later defend.
2. Confounder Map. List every other change programme with a plausible effect on the same three metrics across the measurement window - panel renegotiations, reinsurance treaty changes, headcount moves, catastrophe volume, unrelated process redesigns - and assign each an expected direction and rough magnitude before go-live, not after the numbers come in and need explaining. This is the difference between a benefits report that survives audit scrutiny and one challenged in the first CFO review.
3. Metric Custody. Assign a single accountable owner for the data lineage of each metric - not the technology vendor, not the transformation PMO. Cycle time typically sits with claims operations, leakage with claims audit or actuarial, cost-to-serve with finance. Whoever owns delivery shouldn't also own the definition of whether it worked; that separation is what makes the eventual number credible to a board rather than self-reported.
4. Isolation Window. Define, in advance, a measurement period long enough to separate signal from noise - claims volumes are seasonal - but short enough to predate the next confounding change already on the roadmap. A window with no end date invites exactly the dashboard-reconstruction problem this framework exists to avoid.
None of these four components requires new technology. They require a decision, made before go-live, about what will count as evidence - precisely the decision most claims AI business cases skip in the rush to select a vendor and start the pilot.
Where This Gets Genuinely Hard: The Honest Complexity
None of the above should be read as implying that a clean ROI number is always available if only the measurement design is disciplined enough. Some of the difficulty is structural, not procedural.
Leakage is the sharpest case. Because "should-cost" is a modelled counterfactual, even a well-designed Baseline Lock only ever produces a methodology-consistent estimate, not a ground-truth one. Two carriers with identical claims outcomes can report different leakage rates depending on audit sample size, settlement-variance thresholds, and how subrogation recoveries are treated - which is why the 7-14% industry range cited above is a range, not a point estimate (Ballot and Brassard, 2026). A CFO should expect the isolated leakage number to move the debate, not settle it.
Cost-to-serve carries a second-order problem beyond confounding change programmes: allocation methodology itself is rarely stable even within one insurer over a multi-year window, as finance teams periodically revise how shared services, IT overhead, and compliance cost are apportioned to claims. McKinsey's observation that productivity gains are "consistently offset by rising IT costs, compliance overhead" is itself a statement about attribution difficulty, not just cost pressure - some of what looks like an AI initiative failing to reduce cost-to-serve is actually the allocation base moving under it (McKinsey & Company, 2026).
There is also a scale paradox worth naming honestly. McKinsey's 2024 research on generative AI in insurance estimates a full end-to-end transformation of the claims domain - eligibility checks, fraud detection, settlement optimisation, and customer service acting together - could yield up to 14 times the impact of any single use case implemented in isolation, because the use cases reinforce each other (McKinsey & Company, 2024). That is a strong argument for pursuing claims AI at domain scale rather than as isolated pilots. It is also, for measurement purposes, a harder attribution problem, not an easier one: when several interacting use cases go live together, isolating any one component's contribution to cycle time, leakage, or cost-to-serve becomes close to impossible without the Confounder Map treating each use case as its own tracked variable. Ambition and measurability pull in opposite directions here.
Across APAC and the Gulf specifically, claims estates are frequently a mix of modernised digital-first books and long-tail legacy portfolios on older policy administration systems, acquired through M&A or built up over decades of market entry. A single enterprise-wide baseline across that mix will average away the very effect the AI is meant to produce in the segment where it's actually deployed - making the Isolation Ledger's Baseline Lock component non-optional for a regional or multi-market insurer.
Which of the Three Can Your Initiative Actually Isolate Today?
This is the question worth asking before the next steering committee meeting, not after the annual benefits review. For most claims AI initiatives we observe in the market, the honest answer differs by metric:
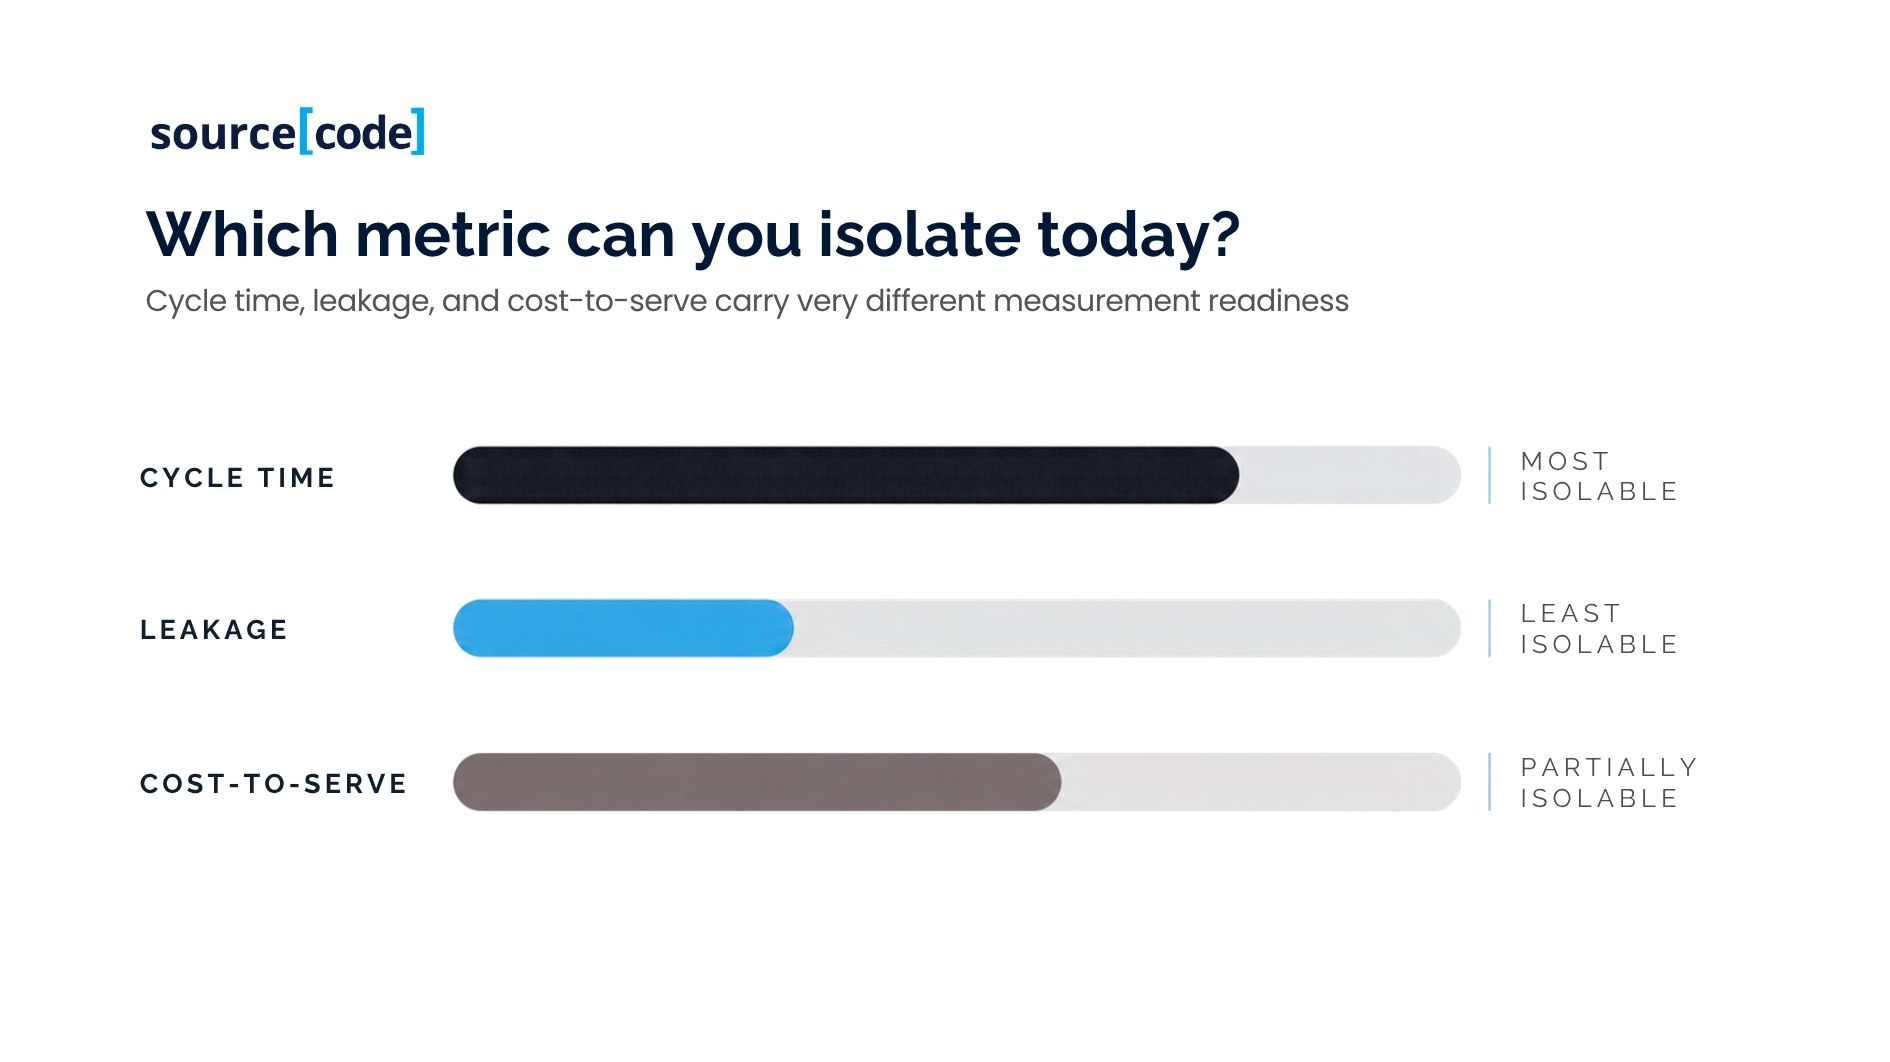
Cycle time is usually most isolable, because FNOL and settlement timestamps already exist in most claims systems - the missing piece is segmentation by complexity, not the underlying data. If you can pull pre-go-live cycle time by claim tier today, you likely have a defensible baseline; a single blended average means a Baseline Lock gap to close first.
Leakage is usually least isolable, not because the data doesn't exist but because a consistent, audited "should-cost" methodology rarely predates the AI initiative - most carriers build that discipline at the same time as the AI programme, leaving no clean pre-period to compare against. If leakage measurement is new, say so in the business case rather than presenting a post-go-live number as an improvement.
Cost-to-serve sits in between: the data exists in finance systems, but the Confounder Map is usually missing. Most finance functions can produce a cost-per-claim trend line; few have documented, in advance, which other movements in claims operations might also explain it. That documentation - not new instrumentation - is usually the fastest fix.
The source[code] perspective
Across claims transformation programmes we've supported for insurers in Australia and the Gulf, the pattern is consistent: the technology almost always works technically, and the ROI conversation almost always turns adversarial anyway - not because the numbers are bad, but because nobody agreed in advance what would count as proof. The most useful thing a delivery partner can do before the first sprint isn't a faster integration; it's forcing the baseline, confounder, and ownership conversation the business case skipped, so finance and claims are arguing about what changed eighteen months later, not about whether the measurement can be trusted at all.
Conclusion
The claims AI ROI problem is usually diagnosed as an economics problem - not enough value delivered - when it is more often a measurement design problem: value never instrumented in a way that could be isolated from everything else happening in the business at the same time.
Cycle time, leakage, and cost-to-serve are the right three numbers precisely because they are the ones a CFO can defend externally, and precisely because they are the ones most vulnerable to confounding by concurrent change. The Isolation Ledger - Baseline Lock, Confounder Map, Metric Custody, Isolation Window - is not a technique applied after the fact; it is a set of decisions made before go-live, at the same table where the technology decision gets made.
Insurers that make those decisions early will have an answer when the board asks what changed. Insurers that don't will still have a working claims AI system - and no way to prove it.
If your claims AI initiative is already live and the ROI conversation is proving harder than the technical rollout, the fastest fix is usually a measurement audit, not a re-platform. See how source[code] approaches claims AI baselining and measurement design. Talk to us!
Frequently Asked Questions
Why can't we just measure ROI from the claims AI vendor's dashboard after go-live? Because a vendor dashboard almost always reports activity (claims processed, hours saved, adoption rate), not the financial outcomes - cycle time, leakage, cost-to-serve - that a CFO or board can defend, and it has no visibility into the other change programmes running concurrently in your claims operation that could explain the same movement (Gartner, 2026). Activity metrics and financial metrics are different questions; a dashboard built for the former can't retroactively answer the latter.
Which of the three metrics - cycle time, leakage, cost-to-serve - should we prioritise measuring first? Start with whichever one your organisation can already segment at the right granularity before go-live. Cycle time is usually most isolable because FNOL-to-settlement timestamps already exist in most claims systems, provided they're segmented by claim complexity rather than blended into a single average (Kamalapurkar and Cline, 2021). Leakage is usually least isolable unless a consistent, audited should-cost methodology already predates the AI initiative (Ballot and Brassard, 2026).
Is claims leakage really as large as 7-14% of payouts, and does that number apply to every insurer? That range is an industry-wide estimate from Insurance Thought Leadership's 2026 analysis, covering claims payouts against insured losses that regularly exceed US$100 billion annually - it is a benchmark range, not a figure that applies uniformly to any single carrier's book (Ballot and Brassard, 2026). Your own leakage rate depends on line of business, claim complexity mix, and - critically - the audit methodology used to define "should-cost," which is why a locked, methodology-consistent baseline matters more than the headline percentage.
Why do productivity gains from claims AI so rarely show up as a lower cost-to-serve? McKinsey's 2026 analysis of insurer economics found that productivity gains from digital tools have been "consistently offset by rising IT costs, compliance overhead, and the complexity introduced by layering new digital tools onto legacy operating models" (McKinsey & Company, 2026). Claims represent roughly 70% of premium dollars collected, so even a partially offset gain is large in absolute terms - but without a Confounder Map isolating other cost movements in the same period, the net effect is easy to lose in the noise (Kamalapurkar and Cline, 2021).
Is this a technology problem or a finance/operations problem? Neither, primarily - it's a measurement design problem that has to be resolved jointly, before go-live, by finance, claims operations, and the delivery team together. BCG's research on enterprise AI value found that most companies don't track financial KPIs for their AI initiatives at all, which is a governance gap rather than a technology limitation (BCG, 2025). The Isolation Ledger exists to close that gap at the design stage rather than the reporting stage.
How long should the post-go-live measurement window be before we report a result? Long enough to smooth seasonal claims volume and complexity mix, but short enough to predate the next confounding change already on your roadmap - a panel repricing, a reinsurance treaty renewal, a headcount change. There's no universal figure; the window should be set, and documented, as part of the Isolation Ledger before go-live, not chosen retrospectively to flatter whichever period looks best (Gartner, 2026).
Reference List
Ballot, J. and Brassard, D. (2026) Claims Leakage Costs Insurers Billions Annually. Insurance Thought Leadership. Available at: https://www.insurancethoughtleadership.com/claims/claims-leakage-costs-insurers-billions-annually (Accessed: 7 September 2026).
BCG (Boston Consulting Group) (2025) From Potential to Profit: Closing the AI Impact Gap. Available at: https://www.bcg.com/publications/2025/closing-the-ai-impact-gap (Accessed: 7 September 2026).
Gartner (2026) 5 AI Metrics That Actually Prove ROI to Your Board. Available at: https://www.gartner.com/en/articles/ai-value-metrics (Accessed: 7 September 2026).
Kamalapurkar, K. (2025) AI will transform the future of insurance claims. Deloitte. Available at: https://www.deloitte.com/us/en/services/consulting/articles/future-insurance-claims-transformation.html (Accessed: 7 September 2026).
Kamalapurkar, K. and Cline, M. (2021) Preserving the human touch in insurance claims transformations. Deloitte Insights. Available at: https://www.deloitte.com/us/en/insights/industry/financial-services/insurance-claims-transformation.html (Accessed: 7 September 2026).
McKinsey & Company (2024) The potential of gen AI in insurance: Six traits of frontrunners. Available at: https://www.mckinsey.com/industries/financial-services/our-insights/insurance-blog/the-potential-of-gen-ai-in-insurance-six-traits-of-frontrunners (Accessed: 7 September 2026).
McKinsey & Company (2026) How AI will reshape the economics of insurance: A CEO's guide to strategy. Available at: https://www.mckinsey.com/industries/financial-services/our-insights/how-ai-will-reshape-the-economics-of-insurance-a-ceos-guide-to-strategy (Accessed: 7 September 2026).