Six Weeks to Five Days - and Why the Tail Mattered More Than the Median
Executive Summary
A regional payments fintech licensed in two ASEAN markets took, on average, six weeks to move a signed merchant from contract to first live transaction. That average was the number in the board pack. It was also the least useful number the company had.
Behind it sat a distribution. Half of all merchant integrations landed inside six weeks; one in ten took eleven weeks or longer; the slowest took nineteen. Sales learned to promise against the slow end, and finance resourced against it. The published median described a business that did not exist.
Working with sourceCode, the company insourced a dedicated integration team - a small platform group owning contract-first API specifications, a reusable certification harness, and conformance tests generated directly from those specifications. Twelve months on, and verified with the client:
- Median time from signed merchant to first live production transaction fell from six weeks to five working days.
- The ninetieth percentile fell from eleven weeks to nine working days - the tail collapsed faster than the median.
- Post-go-live remediation within thirty days fell from 41% of integrations to 6%.
- Quarterly merchant onboarding capacity roughly tripled with no increase in integration headcount.
The strategic point is the second bullet, not the first. A faster median wins a slide; a compressed tail changes what the commercial team is allowed to promise, and therefore what the company can sell.
Bottom line for executives: you do not scale a payments business at the speed of your average integration. You scale it at the speed of your slowest credible one.
Introduction
Monday's piece in this series argued that in APAC embedded finance the margin now has a publication date; Tuesday's argued that permission, not capital, has become the scarcest input to a regional fintech. Both were about external constraints. This one is about an internal constraint almost every APAC payments business shares and very few measure: how long it takes, and how predictably it takes, to connect one more counterparty.
That used to be an engineering detail. It is now the growth model. Bank Negara Malaysia reported almost three million registered DuitNow QR touchpoints at the end of 2025, up from 2.6 million a year earlier, a majority small businesses (Bank Negara Malaysia, 2026); the Bangko Sentral ng Pilipinas counted 2,405,365 registered QR Ph merchant identifiers as at 31 March 2026, served by sixty-two participating institutions (Bangko Sentral ng Pilipinas, 2026). Every one of those institutions is an integration. Every one of those merchants sits behind one.
This is a client spotlight, so it is deliberately specific about mechanics - the mechanics are the transferable part.
Industry Context
Merchant onboarding friction in ASEAN is not an anecdote. It has been named, in public, by the people who own it. PwC Singapore and the Singapore FinTech Association, reporting a Merchant Advisory Group roundtable held in October 2025, recorded that merchant onboarding "differs widely across markets, causing significant inefficiencies", that "inconsistent data formats, screening criteria and documentation requirements slow merchant expansion", and - in the sentence worth reading twice - that "fragmented Application Programming Interfaces (APIs), varying regulatory requirements and divergent processes across jurisdictions hinder scalability" (PwC Singapore and Singapore FinTech Association, 2026). The group's proposed remedies were a standardized refund API, a harmonized ASEAN onboarding baseline and a two-tier standardization model. None exists yet.
The wider standards picture explains why nobody should wait for them. The migration to ISO 20022 has, on its own terms, succeeded: over 97% of cross-border payment instruction traffic had moved to it by February 2026 (BIS Committee on Payments and Market Infrastructures, 2026a). Yet in the same survey round - eighty-two jurisdictions and 197 payment systems, fielded May to September 2025 - only 19% of fast payment systems and 13% of real-time gross settlement systems reported alignment with CPMI's harmonized ISO 20022 data requirements, and only 20% of fast payment systems plan to align with CPMI's API recommendations by end-2028. CPMI's conclusion is that "the continued fragmentation of API technical standards continues to present challenges" (BIS Committee on Payments and Market Infrastructures, 2026b).
Format compliance was achieved; semantic interoperability was not. A companion CPMI brief puts the reason plainly: "financial institutions often follow global release timelines, while market infrastructures apply updates according to domestic schedules and generally support only a limited set of market practices" (BIS Committee on Payments and Market Infrastructures, 2026a). The same brief records that only 40% of participants in Japan's foreign exchange yen clearing system had made their core banking systems ISO 20022-native by summer 2025 - infrastructure migration and institutional readiness are not the same thing.
Meanwhile the integration work does not stop arriving. From 14 November 2026 Swift removes support for unstructured postal addresses in cross-border payment messages - as at April 2026, 61.2% of payments still carried unstructured debtor addresses (Swift, 2026a) - and the CBPR+ roadmap then runs to November 2029 (Swift, 2026b). In the same month, every RITS member in Australia using the Automated Information Facility must complete its ISO 20022 migration, with an operational readiness declaration due six weeks before its onboarding slot and test scenarios defined and executed per message type (Reserve Bank of Australia, 2025). And the MAS and Association of Banks PayNow Generation 2 study has made QR interoperability between PayNow and NETS QR - pay any merchant, regardless of scheme - its first implementation priority, pilot targeted for end-2026 (Monetary Authority of Singapore and Association of Banks in Singapore, 2026).
The integration queue for an APAC payments business is not clearing. It is being refilled by regulators and infrastructure operators on schedules the business does not control.
Current Challenges
The organizations feeling this most acutely are not the ones without a plan. They are the ones whose plan is stuck in delivery. KPMG's Global Tech Report 2026 - 2,500 technology executives across twenty-seven countries, 29% of them in Asia-Pacific and 31% in financial services - found only 14% had fully scaled modern delivery practices, while 29% were funded and actively hitting implementation blocks (KPMG, 2026). The constraint is execution capacity, not intent or budget.
Integration is where that constraint bites hardest, because integration is how fintechs grow. The World Economic Forum, with the Cambridge Centre for Alternative Finance, surveyed 240 fintechs across fifty-nine jurisdictions and found 84% partnering with incumbent financial institutions, API integration the most common form of partnership at 52%, and establishing local partnerships a barrier to cross-border expansion for 48% of respondents (World Economic Forum and Cambridge Centre for Alternative Finance, 2025).
And integration effort varies enormously between organizations doing ostensibly identical work. The clearest public evidence comes from Australia's Consumer Data Right regime, where the Treasury's compliance costs review found implementation costs for data holders ranging from "under $1 million to well over $100 million each" - a hundredfold spread on the same regulated obligation, against a background of twenty versions of binding data standards and more than a hundred formal change proposals since 2020 (Australian Treasury, 2024). That review covers the period to December 2023 and its absolute figures have aged; the dispersion it documents has not been contradicted since.
The failure mode this produces is subtle. Nobody reports it as a problem, because the median looks fine. It surfaces as commercial caution: sales quoting eight weeks because six is not safe, partnership teams declining a category of merchant because "those ones always go badly", finance holding headcount against a worst case that occurs one time in ten. The cost is invisible on any engineering dashboard and considerable on the pipeline.
Key Trends
The movements visible across the better-run APAC payments businesses are not about choosing a different technology.
Integration is being treated as a product with a specification rather than a project with a deadline: the unit of work is a published, versioned API contract a counterparty can read, build against and be certified on, not a bilateral conversation producing a bespoke result each time.
Certification is being automated from the contract itself. Where the specification is machine-readable, the conformance suite a new merchant must pass can be generated from it rather than hand-written per integration - the only way a test estate stays current as the contract changes.
And the capability is being insourced. Capital discipline has, if anything, reinforced that: the UOB, PwC Singapore and Singapore FinTech Association ASEAN survey recorded fifty-three regional fintech funding deals in the first nine months of 2025 against 132 a year earlier, with average deal size up 42% to US$21.4 million, and framed the shift as one from "growth at all costs to growth that lasts", with investors focused on unit economics and operational resilience (UOB, PwC Singapore and Singapore FinTech Association, 2025). That dataset's methodology is not publicly disclosed and the figures should be read as directional - but the direction is not ambiguous. Fewer, larger, later cheques, released against operational proof. Operational proof is a capability you own.
Strategic Analysis
The construct worth taking from this engagement is narrow, and it is worth naming precisely.
The integration tail is the gap between an organization's median time-to-live for a new merchant or partner integration and its ninetieth-percentile time. It is measured in elapsed working days from countersigned contract to first settled production transaction, per counterparty, over a rolling twelve months.
The claim attached to it is that commercial capacity is priced off the tail, not the median. A sales organization cannot responsibly promise a date it hits only half the time, so it promises against roughly the ninetieth percentile. That promise sets the customer's expectation, the revenue recognition profile and, through the sales cycle, the shape of the pipeline. The tail, not the average, is what the market experiences.
This reframes the investment case. Halving a median integration time is an efficiency gain; it makes existing work cheaper. Collapsing a tail is a capacity gain; it changes what the business is able to sell, because the safe promise moves. In this engagement the median improved by a factor of six and the tail by a factor of six and a half - and it was the tail that showed up in the commercial numbers first, because within one quarter the standard contractual onboarding commitment could be rewritten.
Variance is almost never caused by the fast cases. It is caused by the ones that hit an undocumented edge - an unusual settlement cycle, a local KYC field, a partner bank with its own dialect of a standard. Removing variance therefore means removing the bespoke path, not accelerating it. Every integration genuinely handled by the standard contract is one that cannot generate a tail event, which is why the certification harness rather than the headcount is the load-bearing part of this story.
There is an honest counter-argument. If a business integrates fewer than roughly two new counterparties a month, or if each integration is genuinely singular - a direct central bank rail, a sovereign scheme with its own certification regime - an integration factory is over-engineering, and the fixed cost of a standing platform team will exceed the variance it removes. The test is not whether integration feels painful. It is whether the same shape of work recurs often enough for a specification to amortize.
Real-World Examples
The engagement: a regional payments fintech, two ASEAN markets
Starting position. Roughly 1,400 active merchants across two licensed markets, plus acquiring and settlement relationships with several partner banks. Merchant integration was owned by a rotating group drawn from product engineering, supplemented by an offshore agency at peak. There was an API reference document. There was no executable specification and no conformance suite: whether a merchant's implementation was correct was established by trying it in production and watching.
The distribution, measured over the twelve months before the engagement, from countersigned contract to first settled production transaction:
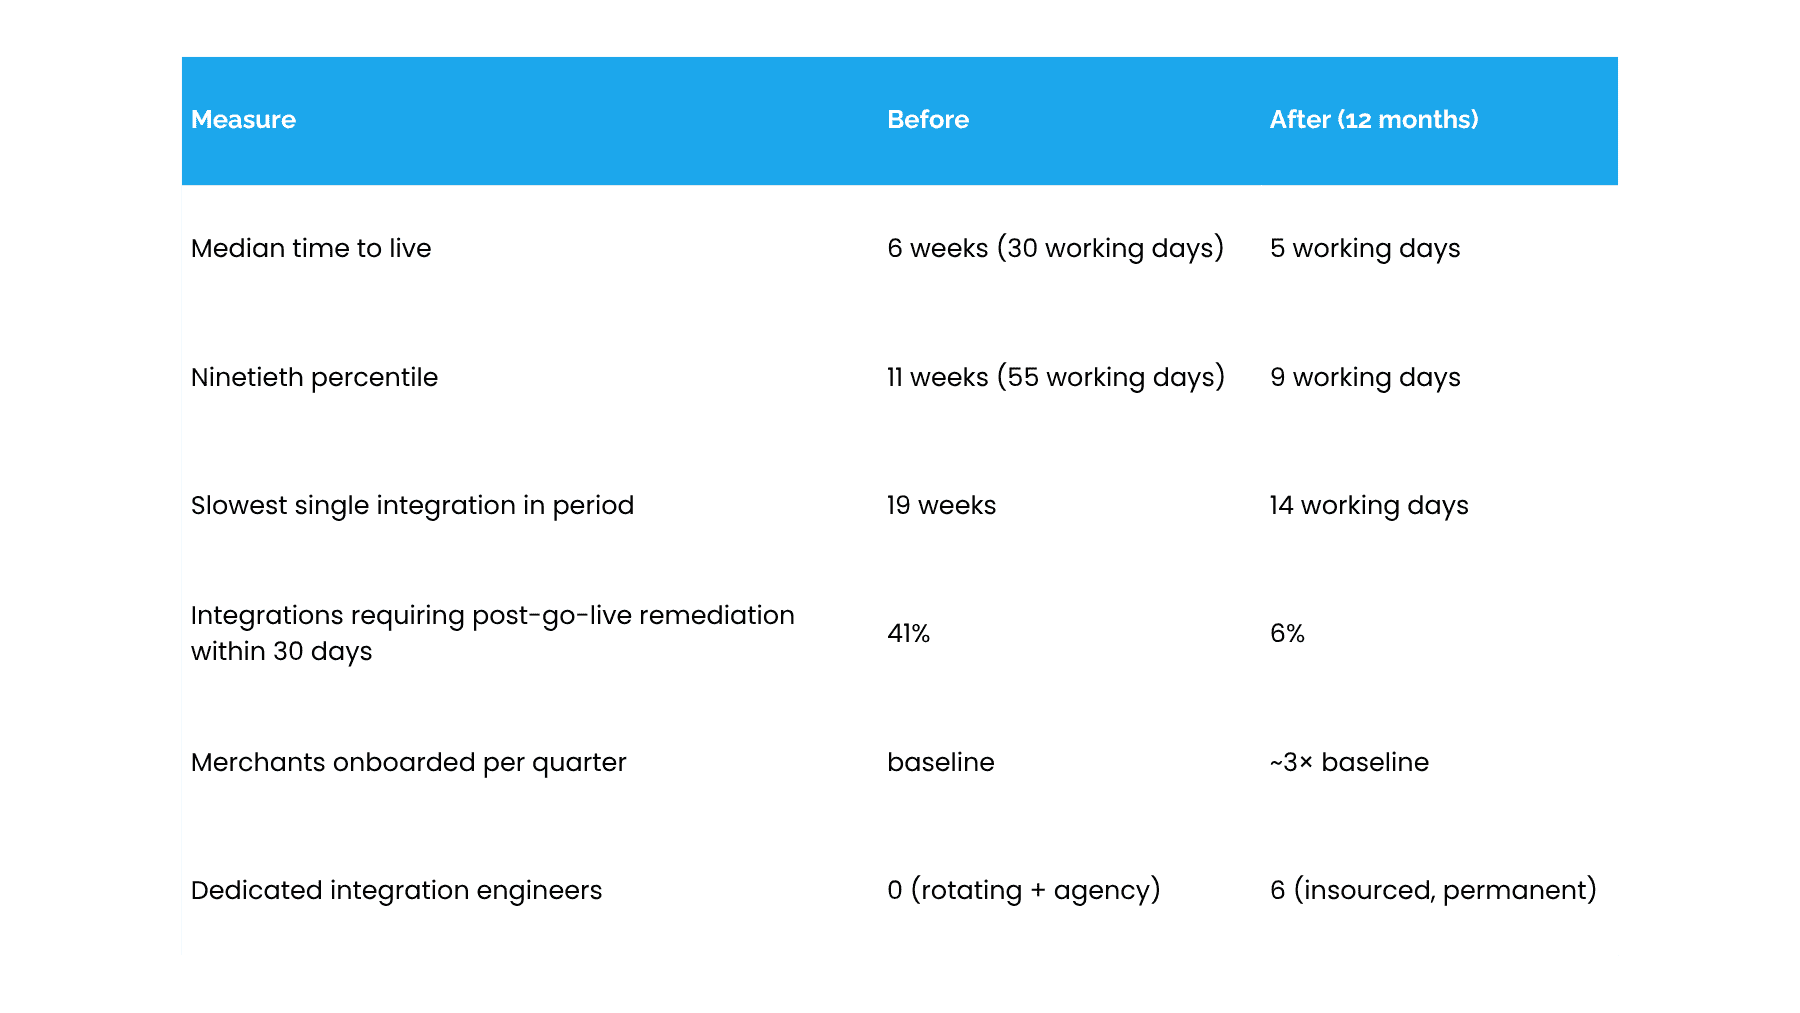
Figures are sourceCode engagement data, verified with the client and published anonymized at their request.
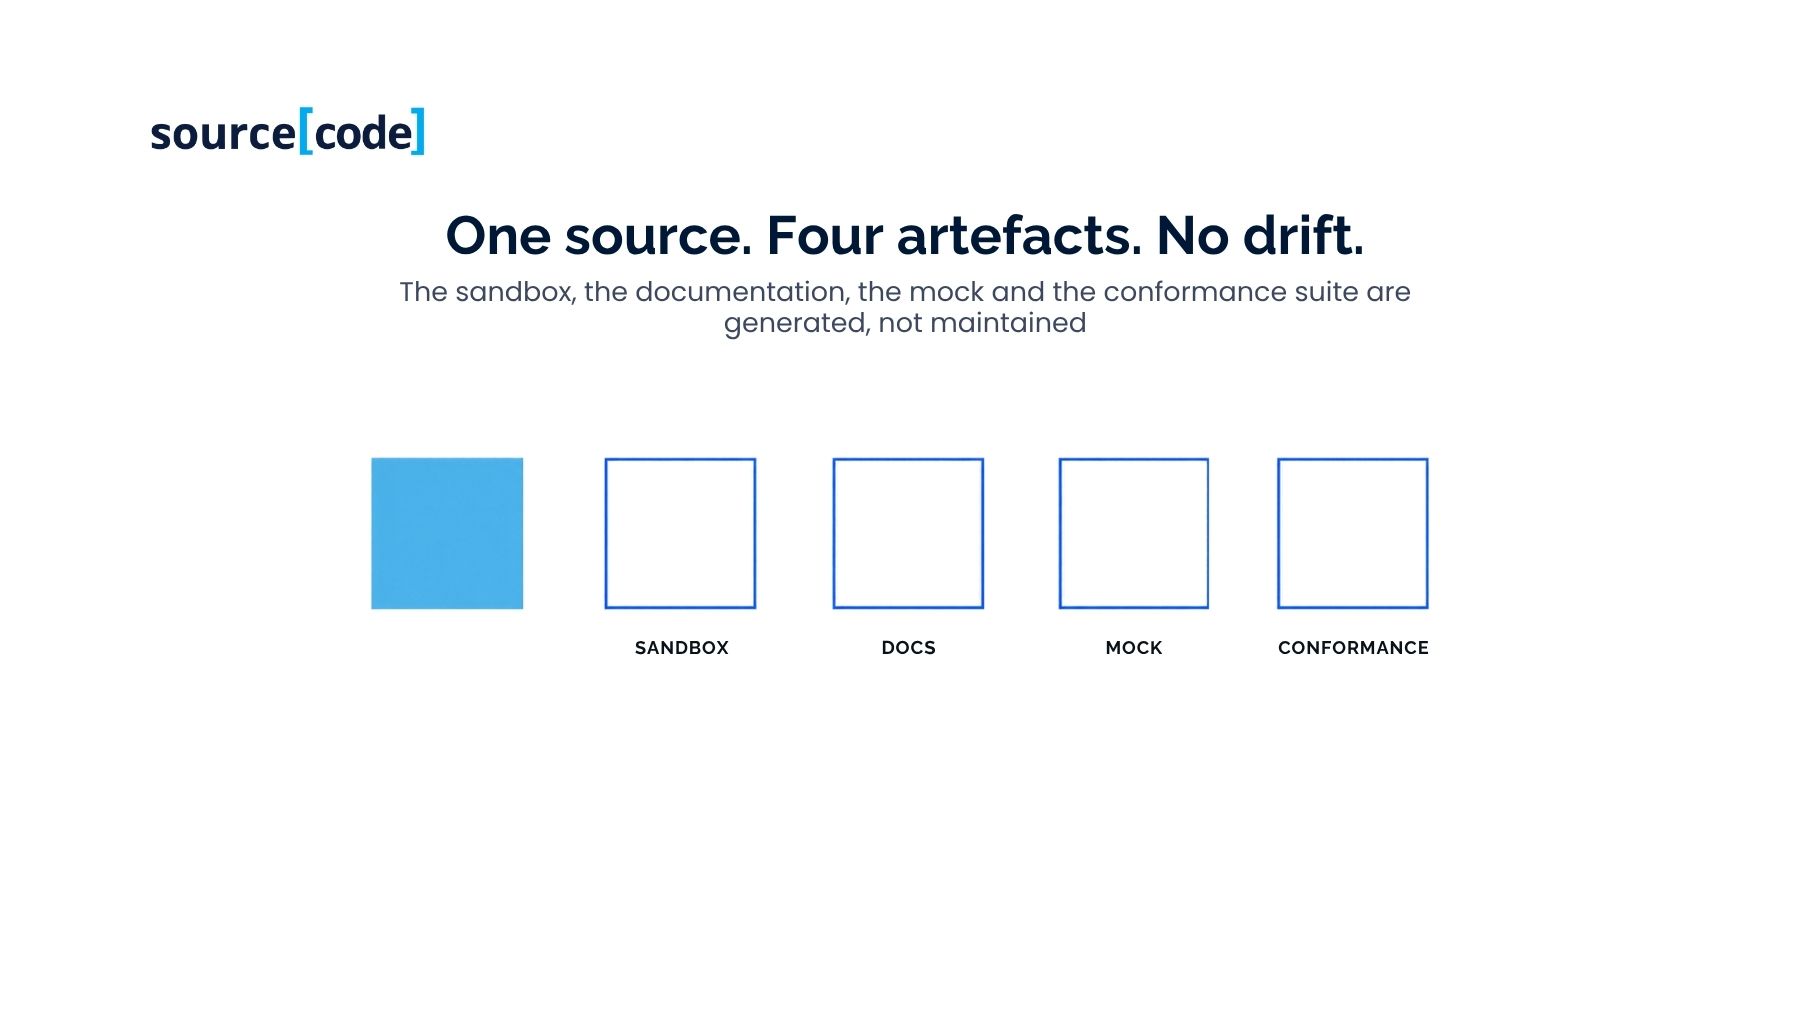
What was actually built. The team wrote a single contract-first OpenAPI specification for merchant integration and made it the source of truth rather than a description of one. The reference documentation, the sandbox, the mock server and the conformance suite are all generated from it, so none can drift. sourceCode's sBrain platform generates the integration test scaffolds directly from the spec, which is what makes regeneration cheap enough to run on every contract change rather than once a release. A new merchant gets sandbox credentials at signature and must pass the generated suite before its first production call; passing the suite is the certification.
Removing the bespoke path was the harder change, and it was organizational. Requests for non-standard behavior now route to the platform team as candidate additions to the specification, with a named owner and a version, instead of being absorbed into a one-off integration by whoever is available. Roughly a third is accepted and become standard for everyone; declining the rest is the mechanism by which the tail stays short.
Where the time actually went. The median improvement came mostly from the sandbox and generated documentation: merchants could start building at signature rather than after a kick-off call. The tail improvement came almost entirely from the conformance suite. Before, a defective merchant implementation was found in production, triaged jointly and fixed over several weeks; after, it fails a named test on day one and the merchant's own developers fix it before anything is connected. The organization did not get better at handling exceptions; it stopped generating them.
What it did not fix. Integrations that depend on a partner bank's release calendar remain long and outside the company's control; the fourteen-working-day worst case was exactly that. Worth saying plainly, because a spotlight claiming a clean sweep is not one anyone should believe.
Actionable Recommendations
For fintech CEOs, CTOs and VPs of Engineering, and for payments leaders inside banks running the same pattern:
Measure the tail before you fund anything. Plot elapsed working days from countersigned contract to first settled transaction across your last twelve months of integrations, and report the median and ninetieth percentile together, permanently.
Ask sales what date they actually quote. The gap between that number and your reported median is the cost of your variance, in the only currency a board reads - and usually the fastest way to get an integration programme funded.
Make the specification executable, not descriptive. A wiki page describing your API will be wrong within a quarter. Generate the sandbox, the documentation and the conformance tests from one machine-readable contract, so drift is structurally impossible rather than merely discouraged.
Certify before you connect. Move validation of a counterparty's implementation from production to sandbox and make passing an automated suite the entry condition. This single change is where tail compression comes from.
Route exceptions to the specification, not to an engineer. Every bespoke accommodation absorbed quietly into one integration is an unowned liability and a future tail event. Give exceptions a named owner and a version number, or decline them.
Insource the recurring work; buy the singular work. The pattern earns its fixed cost only where the same shape of work recurs - and put the November 2026 dates on the same plan, because Swift's structured-address cutover and the RITS migration compete for exactly these engineers. A team with a generated conformance suite absorbs both as contract changes; a team without one absorbs them as a project.
The sourceCode Perspective
We build and run engineering teams for financial institutions, so our bias is visible: we think capability that recurs should be owned rather than rented, and we are paid when clients agree.
What we would defend on the evidence is narrower than "insource everything". It is that integration variance is a measurable, fundable engineering problem currently being managed commercially - absorbed into padded promises, cautious pipeline and conservative headcount - rather than removed. The public data supports the diagnosis even where it cannot supply the number. Nobody publishes a benchmark for integration-time variance in APAC payments, which is precisely why so few boards see it.
sBrain generates the test scaffolding in this engagement and we will not pretend that is incidental. But the transferable idea does not require it: a specification that is the source of truth, a conformance suite generated from it, and a rule that exceptions change the specification rather than bypass it. That pattern works with hand-built tooling, more slowly. We would rather a company ran it with its own tools than ran a fourth bespoke integration with ours.
Conclusion
The headline number here is six weeks to five days, and it is the least interesting thing in the story. Medians move whenever a team tries harder and move back when the team is tired.
What changed this business was the collapse of the eleven-week tail to nine days, because the tail is the number the market actually experiences: the date sales can promise, the horizon finance plans against, the reputation earned with the merchants that did not onboard smoothly. It fell because the organization stopped treating each integration as a piece of work to be done well and started treating it as an instance of a specification to be conformed to - then made conformance a machine's job rather than a good engineer's.
Merchant acceptance across ASEAN is compounding, the standards estate is fragmenting faster than it converges, and November 2026 adds two more mandatory changes to the same queue. The question for a payments business is not how fast it can integrate. It is how narrow it can make the distribution.
If you would rather model the team structure before the conversation, our Insourcing Cost Calculator runs the fixed-cost tradeoff against your current mix and target markets.
FAQ
How long should merchant integration take for a payments fintech in APAC? There is no published APAC benchmark, and any figure claiming to be one should be treated with suspicion. In this engagement the median moved from six weeks to five working days and the ninetieth percentile from eleven weeks to nine working days. The more useful discipline is to measure your own distribution first and report the median and ninetieth percentile together.
Why measure the ninetieth percentile rather than the average? Because the average is not what the market experiences. Sales teams promise against the slow end of the distribution, since a date hit only half the time is not a date that can be committed to a customer. The ninetieth percentile therefore sets the contractual promise, the revenue timing and the pipeline shape.
What is an integration factory? A small, permanent, dedicated platform team that owns the API contract, the sandbox, the certification harness and the integration tooling as a product used by everyone else - as distinct from integration work being distributed across product squads or outsourced per deal. In this engagement it was six engineers.
Can conformance tests really be generated from an OpenAPI specification? Structural and contract-level tests can be generated directly - schema conformance, required fields, error handling, authentication behavior, idempotency semantics. Business-rule and settlement-behavior tests still require deliberate authoring. The value of generation is that the large, tedious, drift-prone majority of the suite regenerates on every contract change instead of decaying between releases.
Is insourcing always the right answer for integration engineering? No. Where integrations are infrequent - fewer than roughly two new counterparties a month - or genuinely singular, such as a direct central bank rail with its own certification regime, the fixed cost of a standing platform team will exceed the variance it removes. The test is whether the same shape of work recurs often enough for a specification to amortize.
What causes the long tail in integration times? Almost never the fast cases. Tail events come from undocumented edges: an unusual settlement cycle, a jurisdiction-specific KYC field, a partner bank running its own dialect of a standard. That is why the remedy is removing the bespoke path rather than accelerating it.
Did ISO 20022 solve payments integration? It solved message format, not semantic interoperability. Over 97% of cross-border payment instruction traffic was ISO 20022 as at February 2026, but only 19% of fast payment systems and 13% of RTGS systems reported alignment with CPMI's harmonized data requirements, and only 20% of fast payment systems plan to align with CPMI's API recommendations by the end of 2028.
How do you evidence an integration-time improvement credibly? Against a definition fixed before measurement begins: what counts as an integration, when the clock starts and stops, and how delays caused by the counterparty are treated. Without those definitions agreed in advance, a reported improvement is unfalsifiable - which is why the definitions are published in the spotlight PDF rather than summarized here.
References
Australian Treasury (2024) Consumer Data Right Compliance Costs Review. Canberra: The Treasury, Australian Government. Report dated December 2023; published August 2024. Available at: https://treasury.gov.au/sites/default/files/2024-08/p2024-512569-report.pdf (Accessed: 5 August 2026).
Bangko Sentral ng Pilipinas (2026) PPDD Payments Bulletin (data as at March 2026). Manila: Bangko Sentral ng Pilipinas. Available at: https://www.bsp.gov.ph/PaymentAndSettlement/PPDD_Payments_Bulletin.pdf (Accessed: 5 August 2026).
Bank Negara Malaysia (2026) Annual Report 2025 - Promoting Safe and Efficient Payment and Remittance Services. Kuala Lumpur: Bank Negara Malaysia. Published 31 March 2026. Available at: https://www.bnm.gov.my/publications/ar2025/ch1e (Accessed: 5 August 2026).
BIS Committee on Payments and Market Infrastructures (2026a) The future of financial messaging: navigating the ISO 20022 migration journey, CPMI Brief No 11. Basel: Bank for International Settlements. Available at: https://www.bis.org/cpmi/publ/brief11.pdf (Accessed: 5 August 2026).
BIS Committee on Payments and Market Infrastructures (2026b) CPMI Brief No 13. Basel: Bank for International Settlements. Survey of 82 jurisdictions and 197 payment systems, fielded May-September 2025. Available at: https://www.bis.org/cpmi/publ/brief13.pdf (Accessed: 5 August 2026).
KPMG (2026) Global Tech Report 2026. Amstelveen: KPMG International. Survey of 2,500 technology executives across 27 countries; 29% Asia-Pacific, 31% financial services. Available at: https://assets.kpmg.com/content/dam/kpmgsites/xx/pdf/2026/01/global-tech-report.pdf (Accessed: 5 August 2026).
Monetary Authority of Singapore and Association of Banks in Singapore (2026) PayNow Generation 2 - Phase 1 Report. Singapore: MAS and ABS. Published 25 June 2026. Available at: https://abs.org.sg/docs/library/mas-and-abs-chart-instant-payments-enhancements-with-paynow-generation-2-study.pdf (Accessed: 5 August 2026).
PwC Singapore and Singapore FinTech Association (2026) Payments' State of Play 2026. Singapore: PricewaterhouseCoopers Singapore. Published 4 February 2026. Available at: https://www.pwc.com/sg/en/publications/payments-state-of-play.html (Accessed: 5 August 2026).
Reserve Bank of Australia (2025) RITS AIF ISO 20022 Migration - Onboarding and Testing, version 1.1. Sydney: Reserve Bank of Australia. Available at: https://www.rba.gov.au/rits/info/pdf/RITS_AIF_ISO_20022_Migration_Onboarding_and_Testing.pdf (Accessed: 5 August 2026).
Swift (2026a) ISO 20022 in bytes: call to action for November 2026. La Hulpe: Society for Worldwide Interbank Financial Telecommunication. Adoption data as at April 2026. Available at: https://www.swift.com/standards/iso-20022/iso-20022-bytes/call-action-november-2026 (Accessed: 5 August 2026).
Swift (2026b) CBPR+ roadmap beyond November 2025, version 5, 22 June 2026. La Hulpe: Society for Worldwide Interbank Financial Telecommunication. Available at: https://www.swift.com/swift-resource/252463/download (Accessed: 5 August 2026).
UOB, PwC Singapore and Singapore FinTech Association (2025) FinTech in ASEAN 2025: Navigating the New Realities. Singapore: United Overseas Bank. Published 13 November 2025. Available at: https://www.uobgroup.com/techecosystem/reports/fintech-in-asean-2025.page (Accessed: 5 August 2026).
World Economic Forum and Cambridge Centre for Alternative Finance (2025) The Future of Global Fintech: From Rapid Expansion to Sustainable Growth, 2nd edn. Geneva: World Economic Forum. Survey of 240 fintechs across 59 jurisdictions, fielded 17 September - 31 December 2024. Published 25 June 2025. Available at: https://reports.weforum.org/docs/WEF_Future_of_Global_Fintech_Second_Edition_2025.pdf (Accessed: 5 August 2026).